How to Compare Models
Once two or more models have been fitted, you probably want to compare them. Comparisons help answer which model is best, and whether the model itself is actually any good.
Note that model comparison depends on fitting the model to the same data, using the same objective function.
General approach for relative comparisons
To see which of two models is better, use the Akaike information criterion or Bayesian information criterion. The lower the value, the better the (relative) fit.
from kriterion.data import ROCData
from kriterion.fit import fit
from kriterion.models import SignalDetection, UnequalSignalDetection
data = ROCData(
signal=[505, 248, 226, 172, 144, 93],
noise=[115, 185, 304, 523, 551, 397],
)
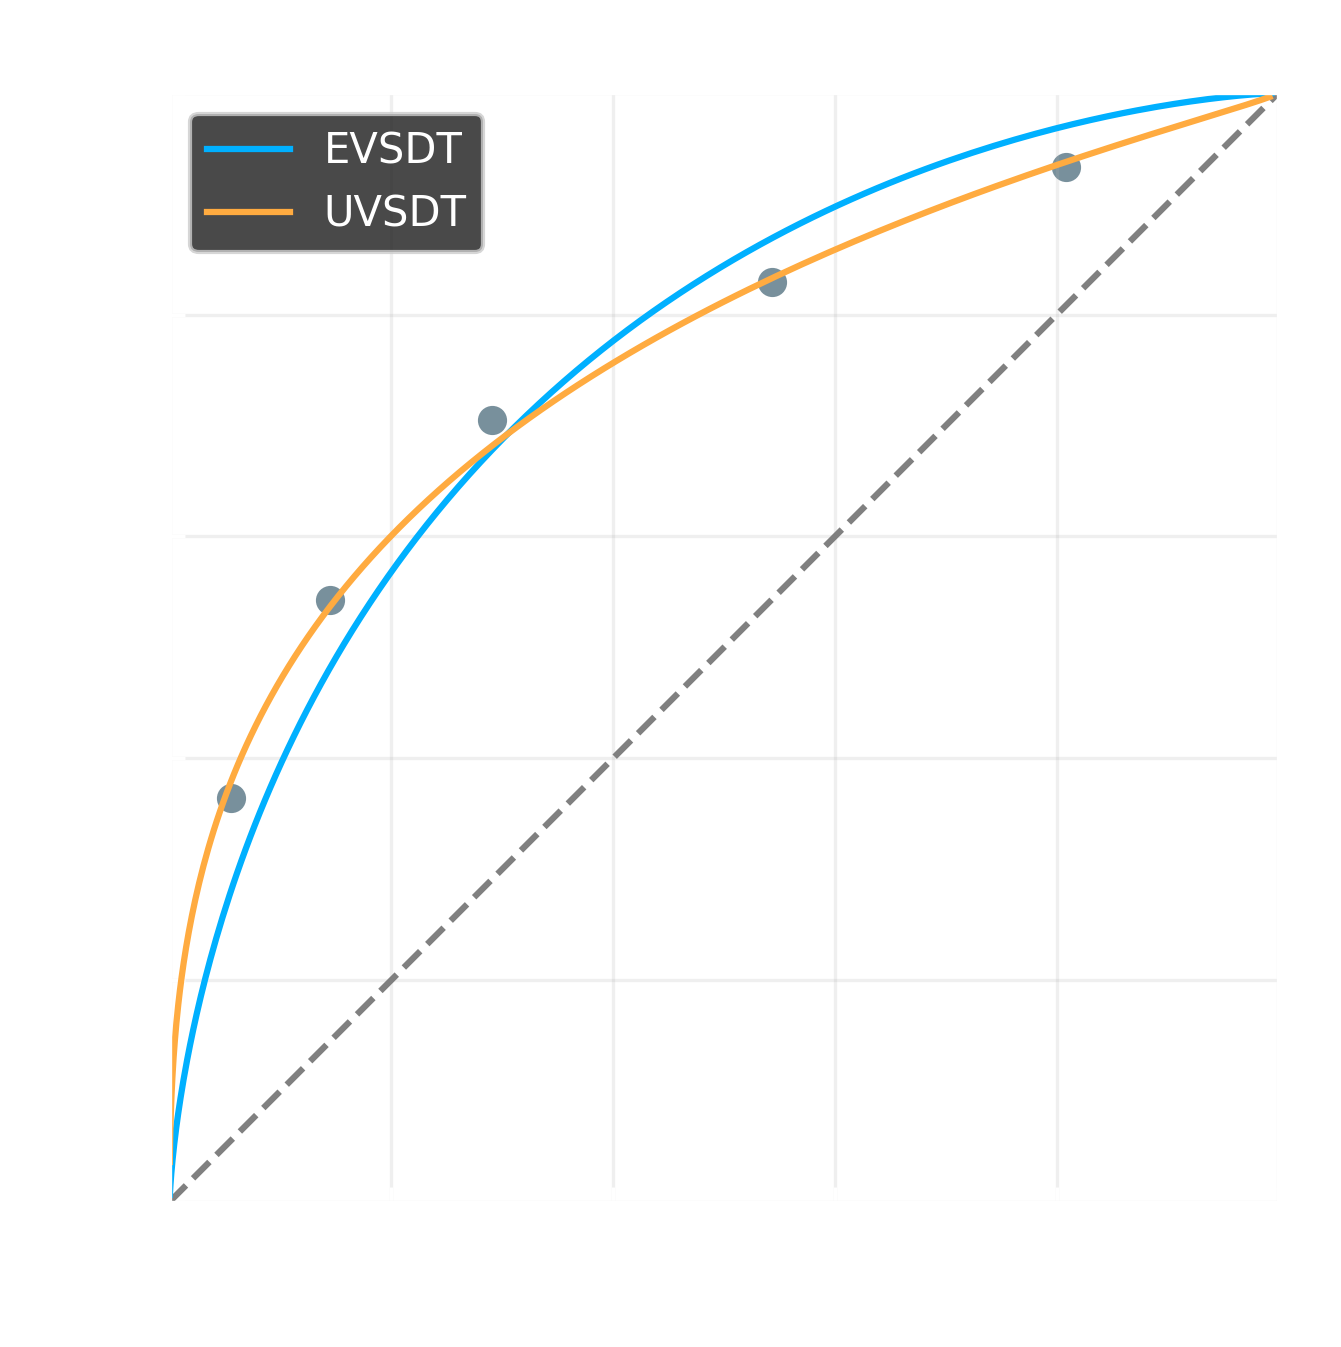
evsdt = SignalDetection(data)
uvsdt = UnequalSignalDetection(data)
evsdt_result = fit(evsdt)
uvsdt_result = fit(uvsdt)
print(f"EVSDT Model: {evsdt_result}\n\nUVSDT Model: {uvsdt_result}")

ModelSummary(
    dof=4,
    chi2=83.99571907067437,
    chi2_p=0.0,
    g2=78.45168122467555,
    g2_p=3.3306690738754696e-16,
    log_likelihood=-5795.6405098990435,
    aic=11603.281019798087,
    bic=11640.1803630645,
    sse=0.0055980393928765715
)
UVSDT Model: ModelSummary(
    dof=3,
    chi2=9.183606301259807,
    chi2_p=0.02694676677704899,
    g2=9.305614752213955,
    g2_p=0.02549179488508846,
    log_likelihood=-5761.067476662813,
    aic=11536.134953325625,
    bic=11579.184187136441,
    sse=0.0004422615018773785
)
Looking at the AIC values, the EVSDT model is a worse fit than the UVSDT (11603 > 11536).
Note that the actual value of the AIC and BIC scores does not tell us anything about whether the model itself is a good fit to the data. To answer that question, just refer to the \(\chi^2\) or \(G^2\) test statistic values of the ModelSummary, along with their corresponding \(p\)-values. In this context, the test statistics test the null hypothesis that the model generated the data, which we hope not to reject, so a non-significant result indicates an adequate fit.
Alternative approach for nested model comparisons
As an alternative to using the AIC or BIC values, if the comparison is between some model \(M_1\) that is nested within some other model \(M_2\), then we can use a likelihood ratio test and obtain a \(p\)-value for the model comparison. This is referred to as a nested comparison.
The example used above - comparing the EVSDT model with the UVSDT - meets this requirement. The EVSDT model has some number of criterion parameters and a single parameter for \(d'\); the UVSDT model has the same, with the addition that it allows for the standard deviation of the signal distribution to vary. To perform a nested comparison we can use the compare_nested helper function:
from kriterion.fit import compare_nested


delta_g2, delta_dof, p_val = compare_nested(evsdt_result, uvsdt_result)
print(f"G^2 = {delta_g2:.2f}, ddof={delta_dof}, p={p_val}")
Here, the test statistic and degrees of freedom of the more complex model are subtracted from those of the simpler model, and then a \(p\)-value is obtained for the resulting difference in \(G^2\) and difference in \(df\).
In this case, that means \(G^2 = 78.45 - 9.31 = 69.14\), and \(df = 1\). Since the \(G^2\) follows the \(\chi^2\) distribution, we can obtain the \(p\)-value for these values, which is \(p \approx 9.14 \times 10^{-17}\), meaning that the UVSDT model gives a significantly better fit.